-
Description of Terms and Graphs
-
F-score
-
RMSE
-
ROC curve and AUC
-
Ensemble
-
Export/Import
-
Relevance Score
-
Coefficient of Determination
-
Missing Value
-
Accuracy Evaluation
-
Confusion Matrix
-
Coverage
-
Cross-validation
-
Mean Absolute Error
-
Median Absolute Error
-
Median Absolute Error Ratio
-
Recall
-
Advanced Settings
-
Information Leakage (Target Leakage, Data Leakage)
-
Regression
-
Accuracy
-
Precision
-
Multiclass Classification
-
Data Type
-
Imbalanced Data
-
Text Handling
-
Parameter Search
-
Binary Classification
-
Classification
-
Prediction Model Creation (Training)
-
Prediction model creation (training) data
-
String Handling
-
Use for the Model
-
Unique Value
-
Distribution of Prediction
-
Distribution of Prediction Errors
-
Prediction Accuracy Level
-
Prediction Reason / Predictive Contribution
-
Prediction Value (binary classification)
-
Predictive Analytics
-
F-score
Distribution of Prediction
Distribution of Prediction is a visualization of the actual prediction. Each set of (predicted values, actual values) in the evaluation data is plotted as a point. You can see the prediction intuitively.
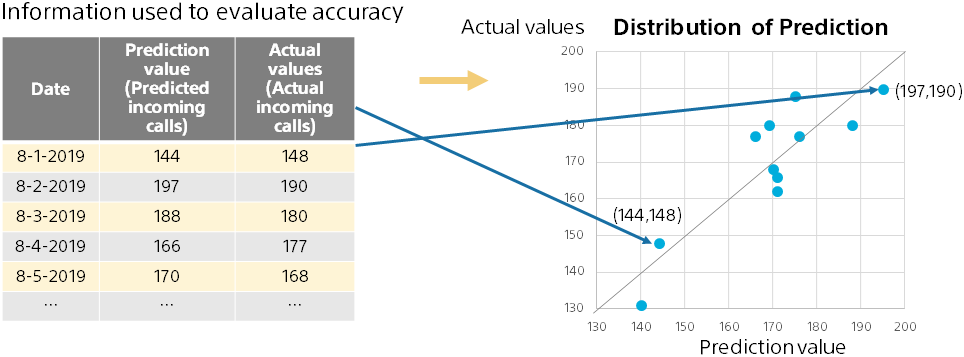
The closer the point is to the diagonal of the graph, the more accurate the prediction. (the predicted value equals the actual value) By looking at the deviation from the diagonal, you can grasp situations such as not being able to predict well when the actual value is large.
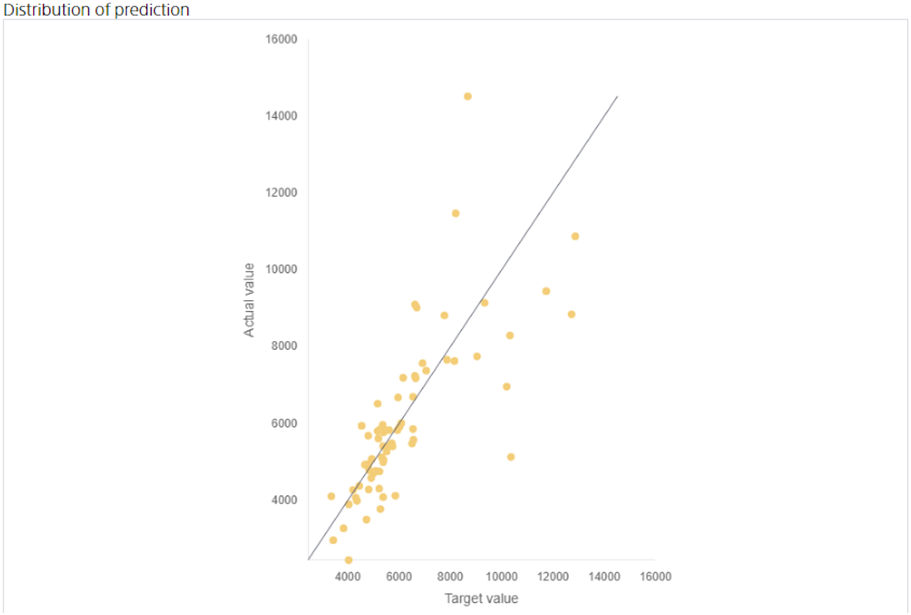
When points are gathered around the diagonal line of the graph, there are many points of data where the actual value is close to the predicted value and the prediction accuracy is high. In such cases, you can expect this model to be a useful predictive model.