Accuracy Detail Screen
Click the Accuracy Details tab to go to this screen.
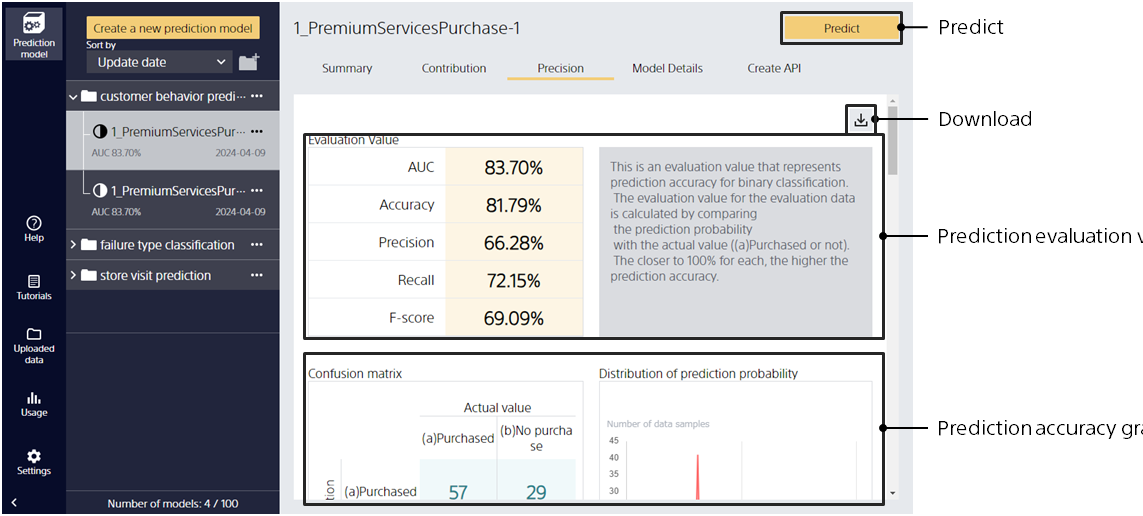
Check the description of the evaluation value of prediction accuracy
Step 1. Place the cursor on the name of the evaluation value for prediction accuracy.
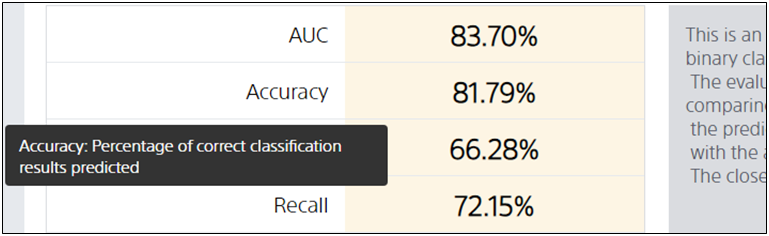
Displays a description of each evaluation value.
View graphs and tables of prediction accuracy
Step 1. Check each graph in the area below the evaluation value.
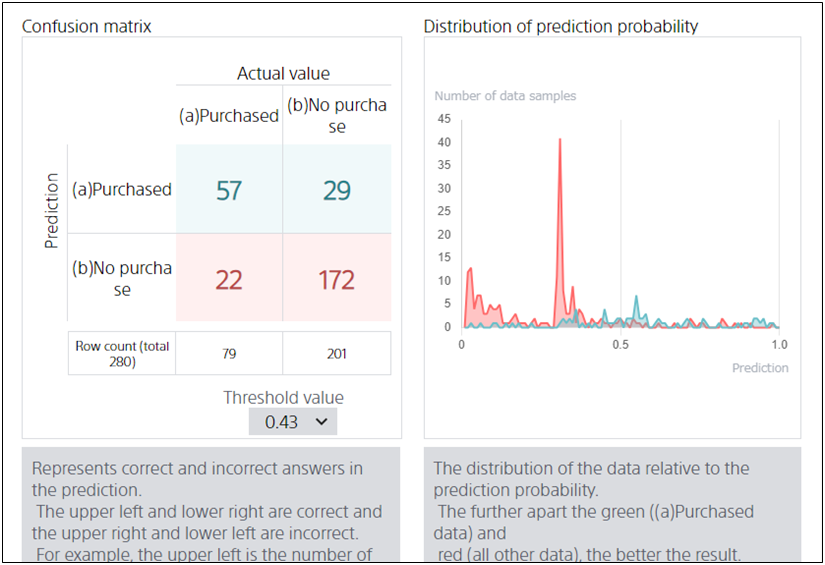
The type of graph displayed depends on the prediction type. For example, for binary classification, a graph of a confusion matrix or distribution of predicted probabilities is displayed.
The type of graph displayed depends on the prediction type. See also Tips on how to check prediction accuracy.
Saving the displayed content as an image
Step 1. Click the Save Image button.
Step 2. Specify the name of the folder in which to save the images. The displayed content is saved as an image (png).